QuickRoute Features
Import of data


In order to create a QuickRoute file you need the map saved as an image file (in the jpeg, gif, png or tiff format), as well as GPS data. For best results, scan in the map or export it from OCAD with a resolution of 150 dpi or higher, but a digital photo will also work. There are several different ways to input data from GPS devices and data files.
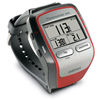
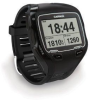
- Download via a USB cable for Garmin's Forerunner series. Forerunner 301 and 305 have been tested successfully. This should also work for older models.
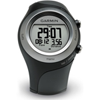
- Wireless download from Garmin Forerunner devices using Garmin ANT Agent.
- Download of files in gpx format, which is a standardized file format used for exchange of geographical information. Many programs for GPS devices are capable of creating gpx-files.
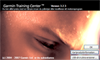
- Download of history files in Garmin Training Center's TCX format. Choose File > Export history in Training Center.
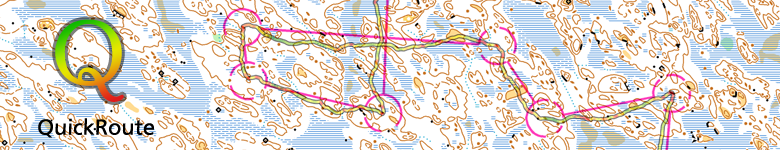
Adjusting the route to the map
The route line is adjusted to the map manually. Three points along the route need to be dragged to the corresponding points on the map. If needed, more points can be used.
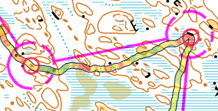
Color-coded route line
The route can be color-coded by the value of one of the following parameters.
- Pace (minutes per kilometer)
- Speed (kilometers per hour)
- Heart rate (beats per minute)
- Altitude (meters)
- Direction deviation to next split time position (degrees)

The color coding can be adjusted, both with regard to colors and to their corresponding values. A semi-transparent color range that goes from green to red via yellow is used by default for the pace parameter.
Split times

Split times taken with a Forerunner clock are automatically downloaded. It is also possible to add, edit, or remove split times. For each split time, length and pace are shown, in addition to time. The pace and length are calculated both along the route and as the crow flies. Additionally, the difference between the length of the route and the distance as the crow flies is shown in percent, and the average direction deviation during the split.
Waypoint information

When you hover over a point along the route or in the line graph with the mouse, the values of the following parameters are shown at the bottom of the program window.
- clock time
- elapsed time
- elapsed distance
- current pace
- current speed
- current heart rate
- current altitude
- current direction deviation to next split time position
- current longitude and latitude
Pace during the session as a line graph
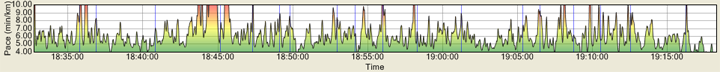
The current pace, or any of the other route parameters, is shown as a function of time in colors corresponding to the color coding of the route.
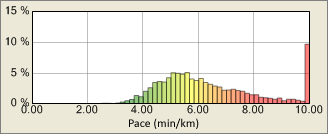
Pace histogram
The distribution of pace values, or those of any other parameter, can be shown per split time or for the entire session. The distribution is shown in a histogram, whose colors corresponds to the route's color coding. The width of the histogram's bars can be adjusted.
Integration with Google Earth


QuickRoute is thanks to the kmz file format tightly integrated with the free Google Earth software. This gives great opportunities to display map images and routes on top of Google Earth's satellite images and terrain models. Google Earth version 5.0 or later has to be installed on the computer in order for a successful integration.
This feature makes it possible to show and replay one or many routes simultaneously in Google Earth. Replay of multiple routes can be accomplished using individual start or simulated mass start.
More information about how to use QuickRoute in combination with Google Earth.
Crop route
It can often be convenient to cut away uninteresting parts of the route, such as warm-up or cool-down. QuickRoute has a function that does precisely that.
Export of data
QuickRoute can export data in the following formats.
- Map and color-coded route line as image files (jpeg, png, tiff). Jpeg files contain route data and can be opened as full-featured QuickRoute documents.
- Pace histogram as image file (jpeg, png, tiff).
- Route as gpx file.
- Map, routes and replay as kmz file.
- Detailed route information as xml file.
Upload maps to DOMA
QuickRoute can automatically upload maps and corresponding information to a web-based DOMA map archive.
Undo and redo
QuickRoute supports undo- and redo-functions for multiple actions.
Language
QuickRoute is available in English, German, French, Swedish, Russian and Norwegian versions.